On Sunday, India will take on New Zealand in the much-awaited Champions Trophy 2025 final at Dubai International Cricket Stadium. Both teams have been absolutely magnificent, which is why we expect a cracking contest in the ultimate showdown.
As both teams gear up for a high-voltage clash, here's a detailed analysis to determine the team which has a higher possibility of winning the Champions Trophy.
We have compared the batting and bowling assets of both teams in terms of their overall performance in the Champions Trophy. The winner of each section will get its win probability increased by 20 units.
Although NZ top order batters have a healthy overall average of 41.08, their low average and strike rate in the powerplay indicate that they have been neither consistent nor aggressive in the first ten overs.
Just like their opponents, India's top order averages just over 28 in the powerplay. However, they have been more dynamic in the first ten overs, as evidenced by their strike rate of 95.3.
Kane Williamson, Virat Kohli and Rachin Ravindra have performed brilliantly, while Shubman Gill and Will Young have struggled after scoring a hundred in their respective first matches.
Impact of IND and NZ top-order batters
Virat Kohli is in sublime form [Source: AP]
Criterion
Average
Strike Rate
Top 3 in NZ venues
38.7
88.13
NZ's Top 3
41.08
86.18
Net Impact (NZ)
+2.38
-1.95
Top 3 in Dubai
37.22
80.13
India's Top 3
47.8
85.8
Net Impact (IND)
+10.58
+5.67
(Comparison of IND and NZ top order in terms of overall impact at their venues)
To evaluate the impact, we have compared the numbers of India and New Zealand's top three batters with that of all top order players in their respective Champions Trophy venues.
It's quite clear from the data that India's top order has had much more impact in Dubai than what NZ's top three have had in Lahore, Karachi, Rawalpindi and Dubai combined.
NZ Players who have batter between number four and eight have maintained a significantly higher average while scoring much faster. The Kiwis have been primarily dependent on Tom Latham and Glenn Phillips, who have recorded exceptional numbers.
On the other hand, India's middle order has done well, but not better than their Kiwi counterparts.
Impact of IND and NZ middle-order batters
Glenn Phillips could be handy for New Zealand [Source: AP]
Criterion
Average
Strike Rate
4-8 batters in NZ venues
35.57
93.40
NZ's 4-8 Batters
48.41
102.10
Net impact (NZ)
+12.84
+8.7
4-8 batters in Dubai
30.56
81.84
IND's 4-8 batters
40
86.17
Net impact (IND)
+9.44
+4.33
(Comparison of IND and NZ middle order in terms of overall impact at their venues)
As evidenced by the above data, New Zealand's middle order batters have been exceptionally better than India's, recording much higher average and strike rate than the overall numbers in the four venues they have played.
So, New Zealand are our winners from this section.
New Zealand's fast bowlers have bagged a larger per cent of the team's total wickets in the Champions Trophy.
However, the Kiwis have been less successful than their Indian counterparts, recording higher average and strike rate than them in the powerplay as well as slog overs.
Shami has bagged eight out of 16 wickets by IND pacers [Source: AP]
Criterion
Average/SR
Economy
Pacers in NZ venues
34.13/34.1
6
NZ pacers
28.10/29.4
5.72
Net impact (NZ)
+6.03/+4.7
+0.28
Pacers in Dubai
28.66/32
5.36
IND pacers
20.81/25.8
4.83
Net impact (IND)
+7.85/+6.02
+0.53
(Comparison of IND and NZ pacers in terms of overall impact at their venues)
To evaluate the impact, we have compared the numbers of India and New Zealand pacers with that of all fast bowlers in their respective Champions Trophy venues.
It's quite clear from the data that the Indian fast bowlers have had much more impact in Dubai than what the NZ seamers have had in Lahore, Karachi, Rawalpindi and Dubai combined.
So, India are our winners in this criterion.
4. Evaluation of spin bowling assets
Criterion
India
New Zealand
% of total wickets taken
56.75
47.22
Wickets in PP
3
1
Average/SR in PP
14.7/20
6/6
Economy in PP
4.40
6.00
Wickets in middle overs
10
15
Average/SR in middle overs
43.4/58.2
28.7/36.8
Economy in middle overs
4.47
4.67
Wickets in death overs
8
1
Average/SR in death overs
14.5/13.9
82/66
Economy in death overs
6.27
7.45
(IND and NZ spinners in Champions Trophy)
Indian spinners have scalped more wickets for them than their pacers. Interestingly, they have performed admirably in the slog overs.
India have relied primarily on Varun Chakravarthy, their only spinner with an average and strike rate less than 20. However, Santner, Bracewell, Phillips and Ravindra have been more penetrative as a unit, as evidenced by their numbers in the middle overs, where spinners play a crucial role.
Impact of IND and NZ spin bowlers
NZ spinners have hunted in a pair [Source: AP]
Criterion
Average/SR
Economy
Spinners in NZ venues
40.55/46.6
5.22
NZ spinners
30.47/36.7
4.98
Net impact (NZ)
+10.08/+9.9
+0.24
Spinners in Dubai
35.23/44.2
4.77
IND spinners
28.28/35.8
4.73
Net impact (IND)
+6.95/+8.4
+0.04
(Comparison of IND and NZ spinners in terms of overall impact at their venues)
To evaluate the impact, we have compared the numbers of India and New Zealand spinners with that of all spin bowlers in their respective Champions Trophy venues.
Spinners from both sides have had a net positive impact for their teams. However, the Kiwis have been more impactful in terms of not only average and strike rate but also economy despite playing three games in Pakistan's placid pitches.
So, New Zealand are our winners in this section.
5. The Home Advantage Factor
With the scoreline reading 2-2, we finally come down to one of the biggest factors- the playing conditions in Dubai. While India have been unbeaten in Dubai, New Zealand have lost the only game they have played here in the Champions Trophy.
Interestingly, they lost to India at this venue in the league stage. So, although they are the finalists, India clearly have the advantage in this section, having played four matches, winning all of them.
Conclusion
India shouldn't be worried as their middle order batters and spinners have had a net positive impact, even though it's not better than the BlackCaps.
With both teams winning in two sections, we considered the home advantage factor, which is in India's favour. This makes us conclude with the fact that India has a 60 per cent chance of winning the Champions Trophy 2025.
![India will take on NZ in the final [Source: AP]](https://onecricketnews.akamaized.net/parth-editor/oc-dashboard/news-images-prod/1741404082831_IND_NZ_Final(1).jpg?type=hq) India will take on NZ in the final [Source: AP]
India will take on NZ in the final [Source: AP]![Virat Kohli is in sublime form [Source: AP]](https://onecricketnews.akamaized.net/parth-editor/oc-dashboard/news-images-prod/1741404146753_kohli_records(2).jpg?type=mq) Virat Kohli is in sublime form [Source: AP]
Virat Kohli is in sublime form [Source: AP].jpg)
![Glenn Phillips could be handy for New Zealand [Source: AP]](https://onecricketnews.akamaized.net/parth-editor/oc-dashboard/news-images-prod/1741404249233_IND_NZ_Final_2.jpg?type=mq) Glenn Phillips could be handy for New Zealand [Source: AP]
Glenn Phillips could be handy for New Zealand [Source: AP]
![Shami has bagged eight out of 16 wickets by IND pacers [Source: AP]](https://onecricketnews.akamaized.net/parth-editor/oc-dashboard/news-images-prod/1741404339565_IND_NZ_Final_3.jpg?type=mq) Shami has bagged eight out of 16 wickets by IND pacers [Source: AP]
Shami has bagged eight out of 16 wickets by IND pacers [Source: AP]![NZ spinners have hunted in a pair [Source: AP]](https://onecricketnews.akamaized.net/parth-editor/oc-dashboard/news-images-prod/1741405008153_IND_NZ_Final_4.jpg?type=mq) NZ spinners have hunted in a pair [Source: AP]
NZ spinners have hunted in a pair [Source: AP]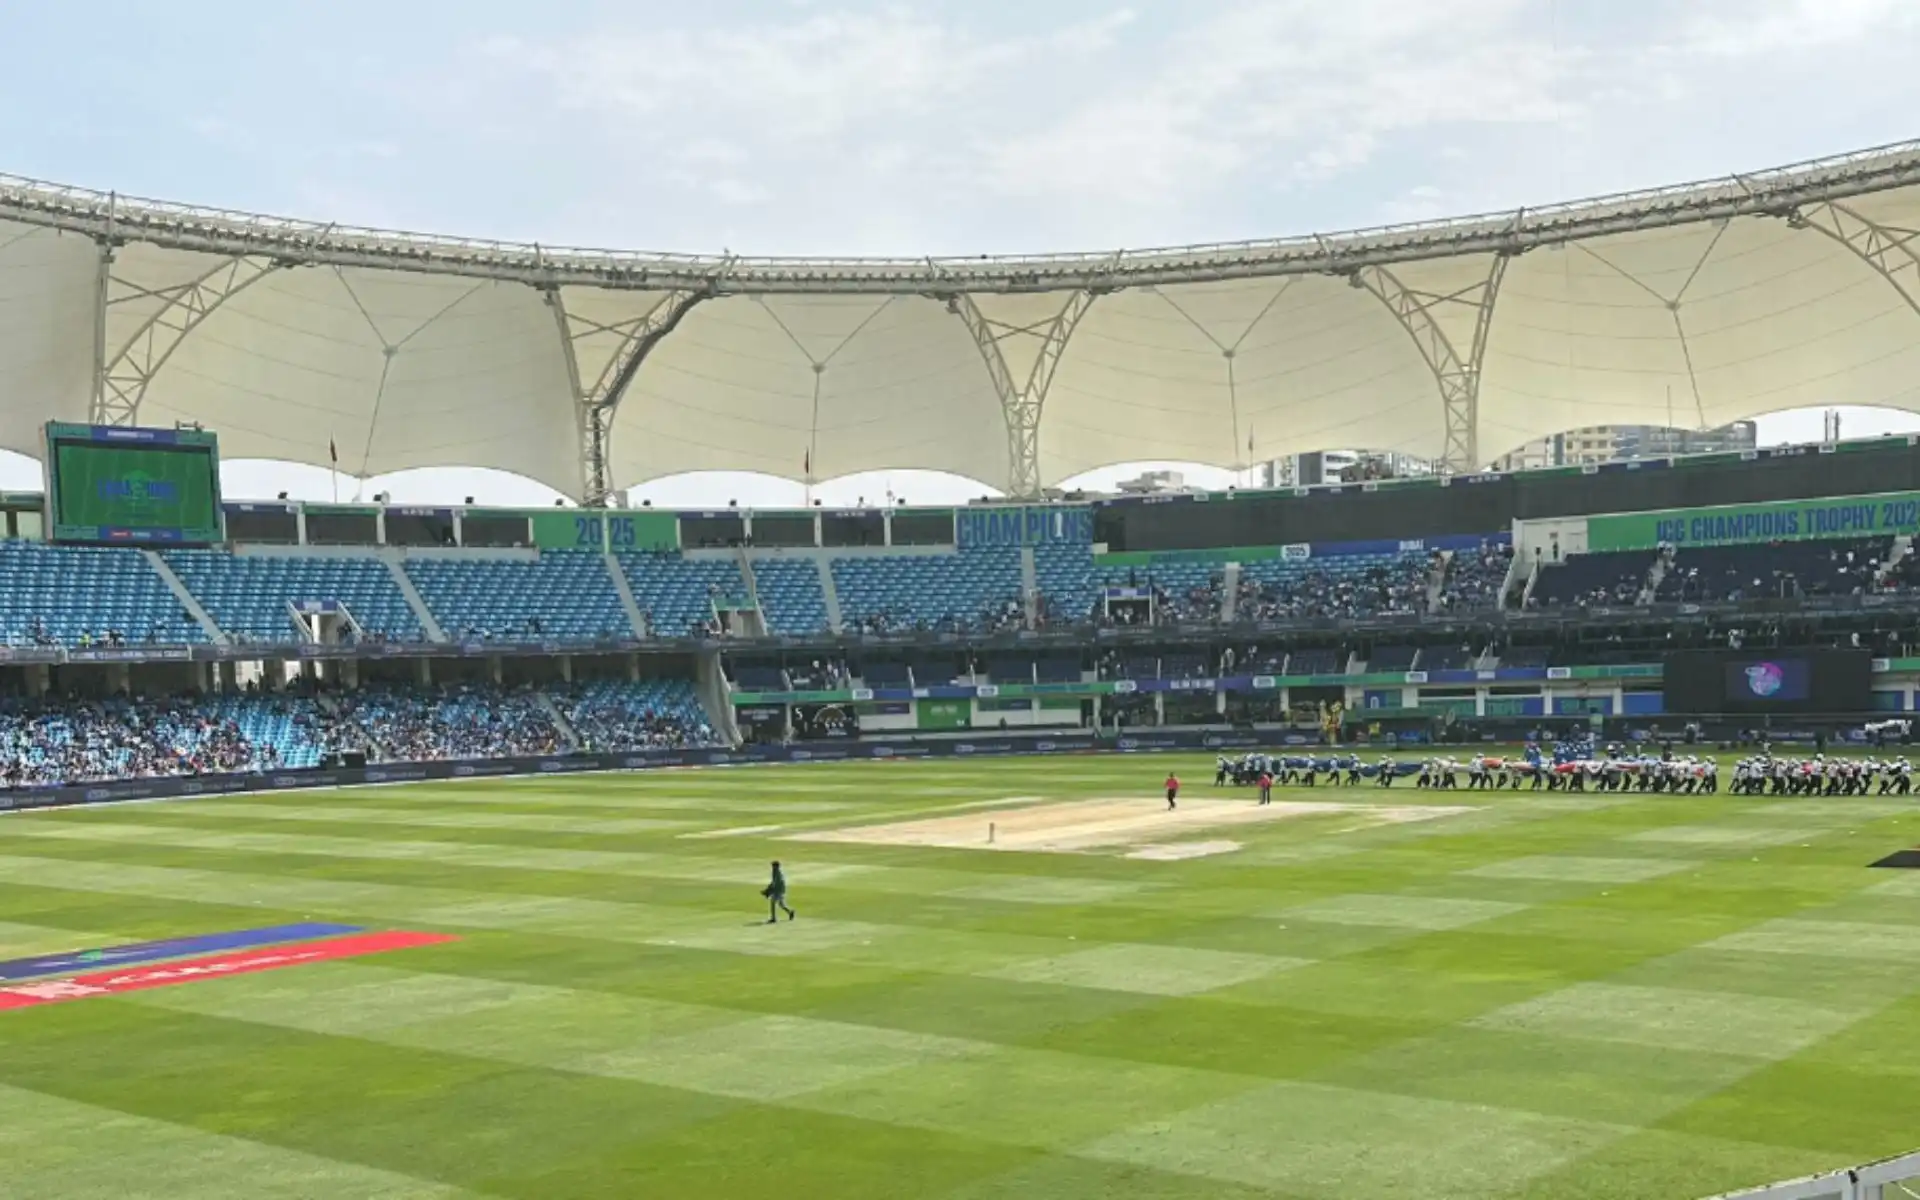


.jpg?type=mq "RCB vs UPW: Weather Report!")
