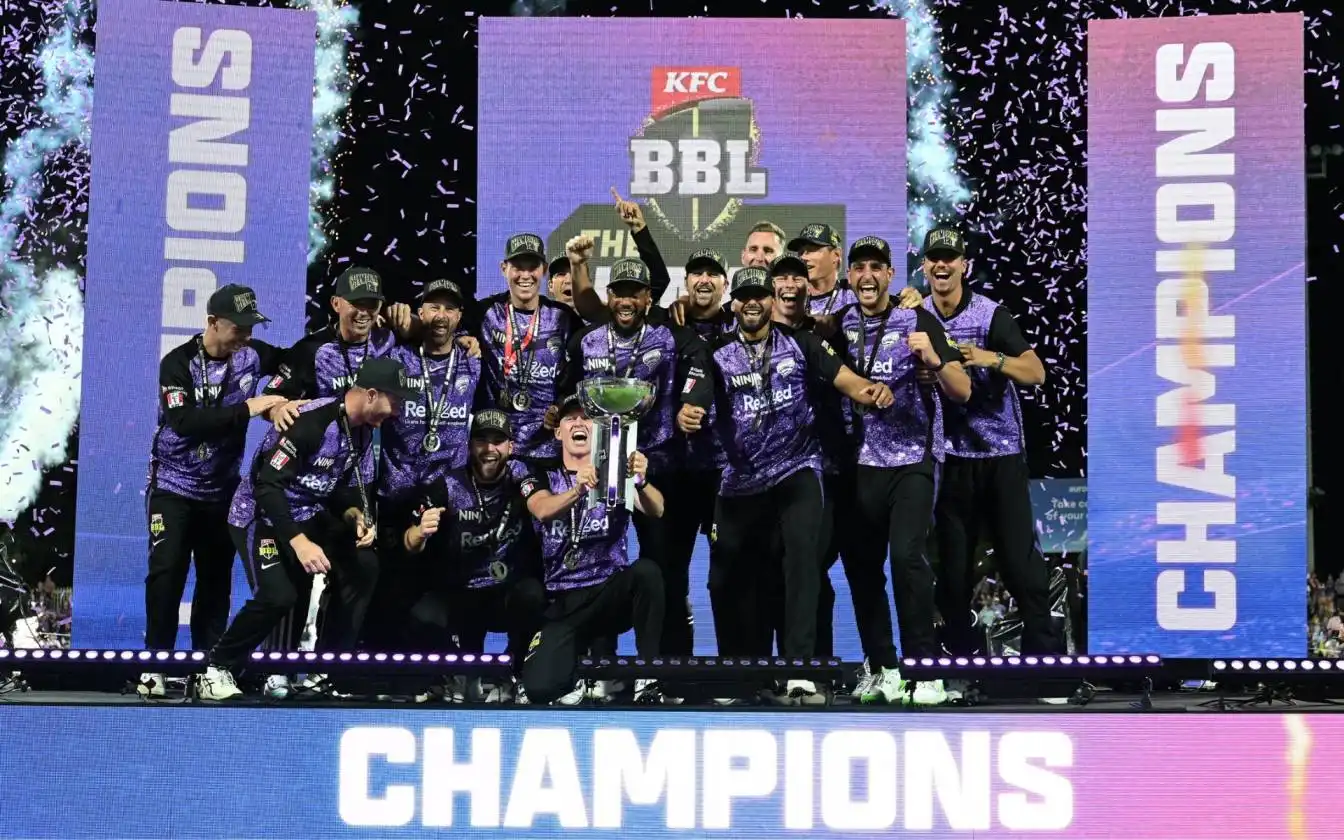
BBL trophy and the IPL trophy [Source: @cricketcomau, @IPL/X]
The Indian Premier League (IPL) and the Big Bash League (BBL) are two of the mega giants of franchise cricket in the world. While IPL remains at the top in terms of popularity and financial turnovers, BBL also excels in the game when it comes to the craze and collabs of the league.
While IPL was established in 2008, BBL had its first season in 2011, which remained tightly knitted around Australian cricket. However, as the league expanded, the viewership and collaboration of players also extended massively.
With franchise cricket, growing every day due to its fast-paced nature and viewer-worthy crispness, the viewership records have also been reaching new feats every day.
With IPL and BBL, both giants in this format of the game, let's see a data-driven comparison of how the IPL and BBL have performed in terms of viewership since their inception.
Let's take a look at the data of viewership that includes TV audiences, digital streaming numbers, cumulative watch-time, and peak concurrency (live watching)
Launched in 2011, the BBL has been one of Australia’s most popular franchise league games. Though significantly less in terms of audience numbers, its viewership scale still reflects consistency on board.
Metric
Record
Season
Highest Average Audience (Season)
1.13 million viewers per match
2015-16
Highest Peak TV Viewers (Match)
2.24 million viewers
2015-16 Final
Average Audience per Game
~770,000 viewers (National)
2024-25
Most Watched Season in India
55 million+ total viewers
2023-24
Highest Match Attendance
80,883 people (MCG)
2015-16
Peak Avg. Attendance (Season)
30,122 spectators per game
2016-17
IPL vs BBL: The huge difference in viewership!
While the raw data points out the stark contrast between BBL and IPL in terms of viewership records, given below is a detailed table on how the Indian giant flays BBL in watch time and watch number metrics.
Metric
IPL
BBL
IPL Share
BBL Share
Average match viewership (TV)
~30–32 million
~0.7–1.1 million
~97%
~3%
Peak single-match viewership
169 million
2.24 million
~98.7%
~1.3%
Peak digital concurrency
55 million
<1 million
~99%
~1%
Total seasonal reach
~1 billion viewers
~55–60 million viewers
~95–97%
~3–5%
Total watch-time contribution
840+ billion minutes
<5 billion minutes
~99%
~1%
Across every major broadcast and digital metric, the IPL commands over 95% of the total T20 league viewership, leaving the BBL with a single-digit global share (as per the data presented here).
Conclusion
Both leagues are successful, but in different ways. The BBL is popular at home in Australia, while the IPL is a worldwide spectacle. When it comes to size, audience, and overall impact, the IPL is unmatched and sets the standard for T20 cricket everywhere, be it Down under or for the neighbours.
(P.S. - The data used for metrics in this article have been collected from sources across the internet with major chunk belonging to Cricket Australia, ESPNcricinfo, University of Technology Sydney, The Economic times and Business Standard)
![BBL trophy and the IPL trophy [Source: @cricketcomau, @IPL/X]](https://onecricketnews.akamaized.net/parth-editor/oc-dashboard/news-images-prod/1765628420588_IPL_vs_BBL.jpg?type=hq) BBL trophy and the IPL trophy [Source: @cricketcomau, @IPL/X]
BBL trophy and the IPL trophy [Source: @cricketcomau, @IPL/X]