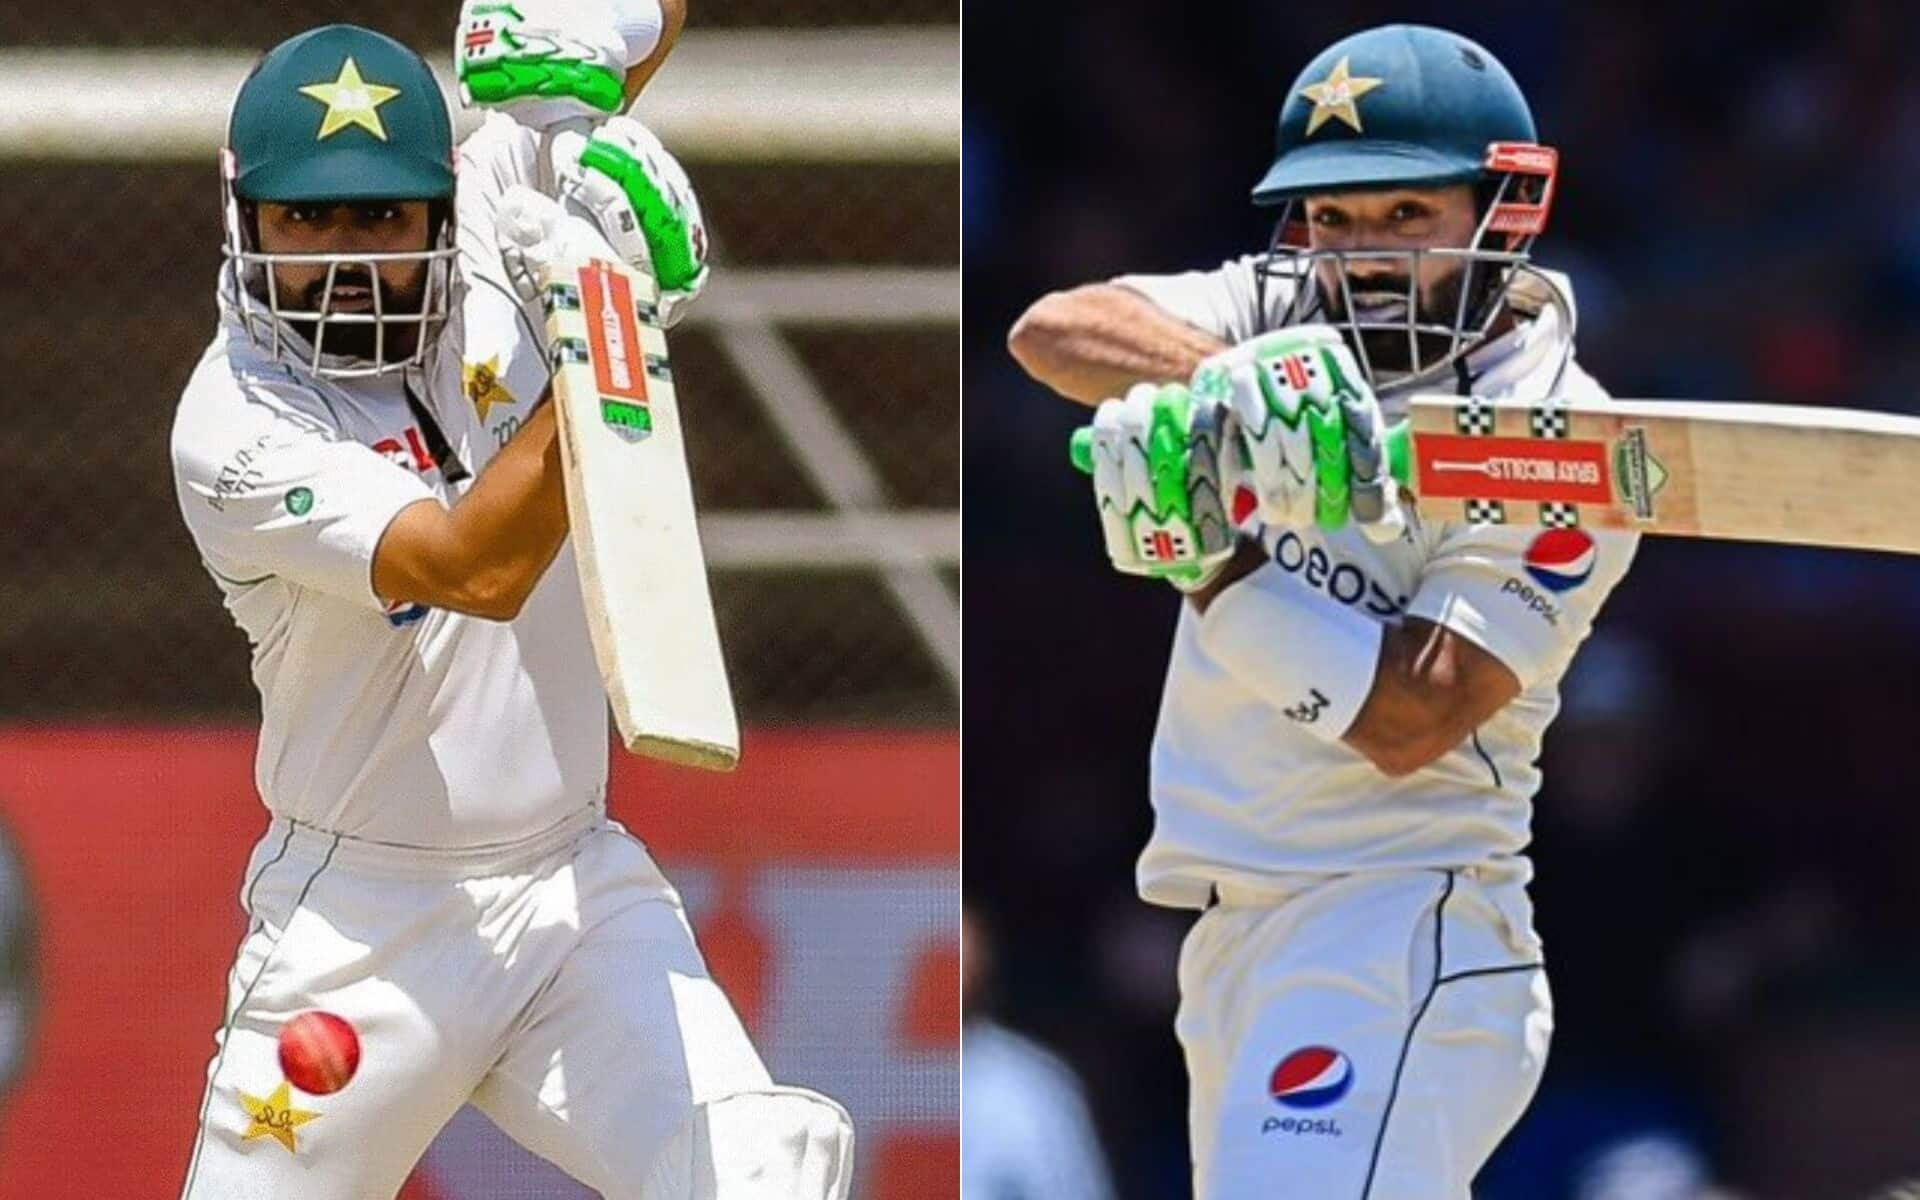
Babar Azam vs Mohammad Rizwan [Source: AFP Photos]
When you talk about Pakistan cricket, two names instantly pop up: Babar Azam and Mohammad Rizwan. One is the smooth stroke-maker who makes batting look like poetry and the other is the fighter who wears his heart on his sleeve and never takes a backward step.
Both have carried the team’s hopes, both have played knocks that turned games around and both have stepped up when the heat was on. But when you zoom in on ODIs, the chatter gets loude: who’s the better batter in the 50-over format?
Fans on social media argue about it like it’s an everyday ritual and even in cricket circles the debate just doesn’t die down. But numbers don’t lie and they are the best way to see where the scales actually tip.
Let’s analyse and finally settle the Babar Azam vs Mohammad Rizwan ODI debate.
Babar Azam vs Mohammad Rizwan Overall ODI Stats Comparison
Stat
Babar Azam
Mohammad Rizwan
Matches
134
94
Runs
6291
2713
Average
54.23
40.49
Strike-Rate
87.63
85.88
Highest Score
158
131*
50/100s
37/19
4/16
Key Takeaways
Babar Azam: With over 6200 runs at an excellent average of 54.23 and 19 hundreds, Babar Azam’s overall record is as elite as it gets. His ability to convert fifties into centuries puts him in the same league as the modern greats. His consistency across a decade shows he is built for this format.
Mohammad Rizwan: Rizwan’s 2713 runs at 40.49 tell the story of a steady contributor rather than a record-breaker. He has moments of brilliance but across the journey, he hasn’t matched Babar’s consistency or conversion rate. Rizwan is steady, often scrapping runs when Pakistan needs them but hasn’t stamped his authority as an ODI giant yet.
Verdict: Babar is a banker, Rizwan is a fighter. Both are valuable but Babar’s long-term class edges it.
Babar Azam vs Mohammad Rizwan ODI Stats Comparison By Opponents
Babar Azam ODI Stats vs Opponents
Opponent
Matches
Runs
Average
Strike-Rate
Highest Score
50/100s
Afghanistan
6
298
49.66
76.02
74
4/0
Australia
13
686
68.60
91.58
114
2/3
Bangladesh
4
123
30.75
88.48
96
1/0
England
20
854
47.44
96.71
158
5/2
India
9
241
30.12
76.26
50
1/0
Nepal
1
151
151.00
115.26
151
0/1
Netherlands
4
227
56.75
77.47
91
3/0
New Zealand
26
1138
47.41
83.30
107
11/2
South Africa
15
744
57.23
85.32
103
6/1
Sri Lanka
12
535
53.50
82.05
115
1/3
West Indies
13
773
64.41
89.46
125*
1/5
Zimbabwe
9
459
114.75
100.43
125
2/2
Mohammad Rizwan ODI Stats vs Opponents
Opponent
Matches
Runs
Average
Strike-Rate
Highest Score
50/100s
Afghanistan
4
98
24.50
83.05
67
1/0
Australia
17
435
39.54
85.79
115
0/2
Bangladesh
5
173
57.66
93.01
67
2/0
England
9
197
24.62
87.55
74
1/0
India
4
97
32.33
64.23
49
0/0
Nepal
1
44
44.00
88.00
44
0/0
Netherlands
3
151
75.50
86.78
69*
2/0
New Zealand
16
483
40.25
84.14
77*
3/0
South Africa
10
343
42.87
88.86
122*
2/1
Sri Lanka
7
353
176.50
109.62
131*
2/1
West Indies
9
175
21.87
75.43
59
2/0
Zimbabwe
9
164
32.80
70.08
75*
1/0
Key Takeaways
Babar vs The Big Boys: Babar owns Australia (68.60 avg, 3 tons), West Indies (64.41 avg, 5 tons), South Africa (57.23 avg) and England (854 runs). Against top-tier teams, he he thrives. That is what makes him elite. However, against India he is yet to make it count.
Rizwan’s Select Brilliance: Mohammad Rizwan stands tall against Sri Lanka (176.50 avg with a century) thanks to multiple not outs and he is handy against Bangladesh and the Netherlands. Against Australia and South Africa, he is solid but not extraordinary. Against England and West Indies, his numbers dip badly, and against India, he hasn’t yet played the defining ODI innings fans hope for.
Verdict: Babar delivers against the heavyweights, Rizwan’s highs are more situational. When you need a man for the big stage, Babar has been the safer bet.
Babar Azam vs Mohammad Rizwan ODI Stats Comparison By Countries
Babar Azam ODI Stats By Country
Country
Matches
Runs
Average
Strike-Rate
Highest Score
50/100s
In Australia
8
362
60.33
82.83
100
1/1
In England
26
1183
51.43
91.28
158
5/3
In India
9
320
40.00
82.90
74
4/0
In Ireland
1
29
29.00
100.00
29
0/0
In Netherlands
3
222
74.00
80.72
91
3/0
In New Zealand
10
305
30.50
81.76
83
4/0
In Pakistan (Home)
26
1597
66.54
93.66
151
9/7
In South Africa
11
571
57.10
86.91
103
4/1
In Sri Lanka
8
189
27.00
71.86
60
2/0
In U.A.E.
21
1119
62.16
85.22
123
5/5
In West Indies
6
210
42.00
79.24
125*
0/1
In Zimbabwe
5
184
184.00
102.22
106*
0/1
Mohammad Rizwan ODI Stats By Country
Country
Matches
Runs
Average
Strike-Rate
Highest Score
50/100s
In Australia
8
125
31.25
69.83
44
0/0
In Bangladesh
3
84
28.00
97.67
67
1/0
In England
5
132
33.00
104.76
74
1/0
In India
9
395
65.83
95.41
131*
1/1
In Netherlands
2
83
83.00
83.83
69*
1/0
In New Zealand
4
88
22.00
79.27
37
0/0
In Pakistan (Home)
23
767
45.11
82.56
122*
5/1
In South Africa
8
190
27.14
82.25
80
2/0
In Sri Lanka
11
314
52.33
100.00
86*
3/0
In U.A.E.
12
327
32.70
84.27
115
0/2
In West Indies
3
69
23.00
63.88
53
1/0
In Zimbabwe
6
139
69.50
79.88
75*
1/0
Key Takeaways
Babar Loves Familiar Turf: At home in Pakistan, Babar averages a sensational 66.54 and in the UAE, he averages 62.16. Even in England and South Africa, he scores consistently. His crazy 184.00 average in Zimbabwe is inflated by not outs, but it still underlines his ability to cash in.
Rizwan Finds Comfort in India and Sri Lanka: Rizwan’s standout numbers are in India (65.83 avg with a century) and Sri Lanka (52.33 avg) where he thrives against spin and slower pitches. He also does well in the Netherlands (83.00 avg) but in tough conditions like Australia and New Zealand, he has struggled big time to make an impact.
Verdict: Babar dominates across continents, Rizwan shines in select patches. One is a global run-scorer, the other a situational performer.
Babar Azam vs Mohammad Rizwan ODI Stats Comparison Year By Year
Babar Azam ODI Stats By Year
Year
Matches
Runs
Average
Strike-Rate
Highest Score
50/100s
2015
7
230
38.33
89.14
62*
3/0
2016
11
656
59.63
95.21
123
2/3
2017
18
872
67.07
79.27
125*
2/4
2018
18
509
36.35
81.18
106*
2/1
2019
20
1092
60.66
92.30
115
6/3
2020
3
221
110.50
101.84
125
1/1
2021
6
405
67.50
108.00
158
1/2
2022
9
679
84.87
90.77
114
5/3
2023
25
1065
46.30
86.65
151
10/2
2024
6
228
57.00
76.51
73
2/0
2025
11
334
30.36
78.40
78
3/0
Mohammad Rizwan ODI Stats By Year
Year
Matches
Runs
Average
Strike-Rate
Highest Score
50/100s
2015
14
332
36.88
95.95
75*
3/0
2016
6
77
19.52
90.58
34*
0/0
2017
5
51
17.00
62.96
21
0/0
2019
7
245
49.00
89.09
115
0/2
2020
3
25
8.33
41.66
14
0/0
2021
6
134
22.33
96.40
74
1/0
2022
8
201
33.50
81.04
69*
2/0
2023
25
1023
63.93
93.76
131*
7/1
2024
9
264
52.80
80.73
80
2/0
2025
11
361
36.10
71.20
122*
1/1
Key Takeaways
Babar Azam: Babar’s numbers scream consistency. From 2016 to 2022, he was piling up runs like a printing press. In 2017 and 2019, he was Pakistan’s backbone, averaging well above 60. His 2022 was golden, averaging 84.87 with three hundreds in just nine games. Even in dismal years like 2023 and 2025 where the average dipped below 50, he still churned out runs in bulk.
Mohammad Rizwan: Rizwan’s early ODI career was stop-start. Between 2015 and 2017, he never really nailed down a spot and struggled to average 20 at times. But from 2019 onwards, he found his rhythm. The real breakthrough came in 2023 when he crossed the 1000-run barrier at an average of 63.93. That year alone silenced critics and stamped him as a serious ODI batter. Since then, he has been more consistent, but still doesn’t match Babar’s decade-long dominance.
Strike Rate Story: Babar has balanced elegance with efficiency. His strike rate stays steady in the 80–90 range, never flashy but always effective. Rizwan, though, shows bursts: sometimes above 90 (2023), sometimes dipping badly (2020’s 41.66 SR). That volatility tells you he adjusts but isn’t as naturally fluent in ODIs as he is in T20Is.
Verdict: Babar is long-term banker, consistent across years, always cashing in. Rizwan is late riser, had one massive year in 2023, but overall still trails Babar.
Babar Azam vs Mohammad Rizwan ODI Stats Comparison As Captain
Babar Azam ODI Stats As Captain vs Not Captain
Role
Matches
Runs
Average
Strike-Rate
Highest Score
50/100s
As Captain
43
2370
60.76
91.22
158
17/8
Not Captain
91
3921
50.92
85.59
125*
20/11
Mohammad Rizwan ODI Stats As Captain vs Not Captain
Role
Matches
Runs
Average
Strike-Rate
Highest Score
50/100s
As Captain
20
625
41.66
74.94
122*
3/1
Not Captain
74
2088
40.15
89.80
131*
13/3
Key Takeaways
Babar Azam: Captaincy has only made Babar stronger. His average catapults from 50.92 to 60.76 when he is leading. That is a sign of a true leader, not crumbling under pressure but actually upping the game. The strike rate also improves (91.22 vs 85.59) which shows he takes more responsibility and plays with intent when the team looks up to him.
Mohammad Rizwan: For Rizwan, the story flips. Without the armband, he has a healthier strike rate (89.80) and nearly the same average (40.15). But as captain, while his average slightly improves (41.66), his strike rate crashes to 74.94. That suggests captaincy makes him more cautious, maybe too cautious, affecting his natural flow.
Verdict: Babar the captain is even more dangerous than Babar the batter while Rizwan is yet to master the art of leading without losing his flow.
Conclusion
At the end of the day, numbers don’t lie and neither does the eye test. Babar Azam is Pakistan’s ODI gold standard. He is the one piling up runs year after year, converting starts into hundreds and bossing attacks across continents. He has got the swagger, the elegance and the cold consistency that every team dreams of in their No. 3.
On the other hand, Mohammad Rizwan is the street-fighter. He scraps, he grinds and when the chips are down, he finds a way to hang in. His 2023 purple patch showed he can be world-class in ODIs too but across the long haul, he hasn’t matched Babar’s volume or dominance.
So, who’s the better ODI batter? Babar by a country mile.
Rizwan is valuable, no doubt, but Babar’s numbers put him in conversations with the very best of this era.
Simply put: Rizwan is the heartbeat but Babar is the backbone. One lifts the spirit, the other lifts the scoreboard!
![Babar Azam vs Mohammad Rizwan [Source: AFP Photos]](https://onecricketnews.akamaized.net/parth-editor/oc-dashboard/news-images-prod/1755417418365_babar_azam_mohammad_rizwan_pakistan.jpg?type=hq) Babar Azam vs Mohammad Rizwan [Source: AFP Photos]
Babar Azam vs Mohammad Rizwan [Source: AFP Photos]


.jpg?type=mq "Justice For Jaiswal!")

